In the project Digital Stambanan, we are developing demonstrators of this kind to test functionality and share knowledge and experiences from the project with other companies and organizations.
The project is divided into different work packages. In the first work package (WP1), we are working with a value chain in the steel industry where steel from SSAB, together with C-parts (such as screws and nuts) from Bufab, is delivered to Nitator. Nitator processes, welds, paints, and assembles products for the automotive industry. The focus of WP1 is on logistics flows, the ability to meet customer deadlines, and the traceability of products and materials in the value chain. Various demonstrators are being created in the project to demonstrate the functionality of the developed techni. Together in WP1, four focus areas for data sharing in the value chain have been selected:
- Product data
- Delivery assurance
- Understanding customer requirements
- Visualization of climate impact
Of these areas, two different demonstrators have begun development. One aims to demonstrate the possibilities of digital platforms for increased sustainability and the other for delivery assurance. Two of the technology providers in the project are providing solutions for developing these demonstrators. The sustainability demonstrator is built on ChainTraced’s digital product passport platform, which provides traceability throughout a value chain. Rockwell Automation’s visualization platform FTOptix, an interface-based traceability solution, is used for the delivery assurance demonstrator.
Opportunities with the use of digital platforms for sustainability
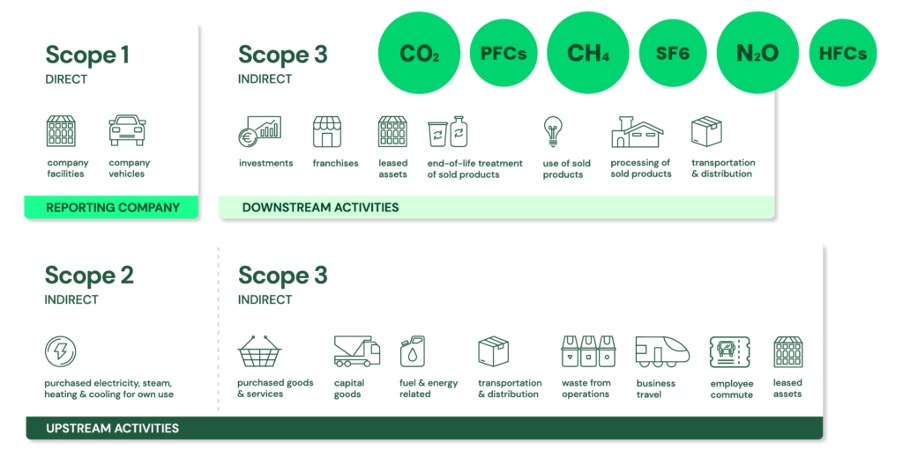
ChainTraced’s platform assists in visualizing the entire value chain’s carbon footprint, including emissions for Scope 1, 2, and 3 (Figure 1). In this way, all companies in the value chain can calculate and share their greenhouse gas emission data to promote sustainable business models. The ‘Traceback view’ in ChainTraced’s platform contains a tree structure with details of the final product, including data for all components and the total carbon footprint (Figure 2). The value created by this solution is that the final product bears a stamp with traceability from the entire manufacturing chain. Each participant in the value chain can then obtain information about producing environmentally friendly steel (i.e., steel with a low carbon footprint) and steel that can contribute to the circular economy (i.e., steel that can be efficiently recycled or managed for waste reduction). The platform also enhances collaboration and visibility in the value chain by identifying where the most significant carbon footprint is generated in the value chain (hotspots).

Figure 1 Scope 1, 2 and emissions (Source: PlanA).
Challenges and upcoming tasks
In the initial version of the demonstrator, historical data with certain assumptions and qualified estimates have been used to establish communication between companies in the value chain. Initially, data has been transmitted in connection with product deliveries and only for one type of material. The CO2 data sent is at the product level and is currently updated twice a year.
In the next phase, more realistic data is desired at the batch level and for different types of materials. To enable each participant in the value chain to provide more realistic batch-level data, more automation is needed in the collection of information and connections between the parties’ internal systems and the demonstrator. This, in turn, poses challenges due to varying levels of digital maturity, as well as privacy and IT security issues.
In future stages, the demonstrator could be developed towards individual-level CO2 traceability. In that case, this would impose even higher demands on the systems’ ability to deliver the detailed information needed. Even more data from the process (OT) needs to be integrated with data from the business systems (IT) and other surrounding systems. Products and components need to be physically marked to be identified. This places higher demands on the logistics for physical and digital traceability throughout the entire value chain.

Figure 2 Traceability tree generated from data collected from various actors in the value chain. The green bars represent the contribution to the total carbon footprint (Source: ChainTraced).

Arpita Chari – WP-leader, Chalmers University.
The members of our work package have dedicated their efforts to transforming complex supply chain data into clear visualizations where carbon footprint and product status can be viewed. With imperatives from EU’s Green Deal and customer requirements for green steel (introduction of the EU’s Corporate Sustainability Reporting Directive (CSRD)), this effort has never been more relevant than now. By engaging in the tasks being carried out in this work package – especially with regards to digital platform implementation – our partners enhance their sustainability credentials by highlighting key areas or hotspots in the value chain. This not only fosters transparency and accountability but also aligns with the latest regulations. We aim to inspire other companies on similar transformation journeys, not just to meet these new regulatory requirements but to promote a sustainable future where manufacturing plays a huge role.
Read more about WP1 here.
Digitala Stambanan strengthens the Swedish industry through digitalization of value chains. The project is a collaborative project financed by Vinnova and participating companies. The work is now underway in two tracks through the strategic innovation programs PiiA (Processindustriell IT & Automation), which drives the Digitala Stambanan IndTech project, and Produktion2030, which runs the Digitala Stambanan Produktion project.

